What is conjoint analysis?

Conjoint analysis is a popular survey-based methodology for discovering people’s preferences that is widely used for market research, new product design and government policy-making.
In the social sciences, conjoint analysis is also known as a discrete choice experiment (DCE) (
This is a non-technical and practical overview for people who are interested in doing conjoint analysis. For people who are new to the area especially, and others who are already familiar with it, this article is for you!
If you are a newcomer, after having read this article carefully you should feel comfortable about doing a conjoint analysis yourself. If you are an experienced practitioner, there is bound to be useful information here for you too.
Consistent with the practical focus, over a third of the article is devoted to an example of a conjoint analysis survey and detailed discussion of how to interpret the results; and the article closes with a summary of common methods for finding participants for a conjoint analysis survey.
A 4-minute introduction to conjoint analysis

What is conjoint analysis used for?
Conjoint analysis is used for discovering how people feel about the various attributes or characteristics of a product or other areas of interest like government policy.
Conjoint analysis elicits this information about people’s preferences via surveys, often performed using specialized conjoint analysis software. Depending on the application, survey participants could be consumers, employees, citizens, etc – “stakeholders”, in general.
From people’s answers to the conjoint analysis survey, the relative importance of the attributes of the product (or government policy) are quantified. This information is used for improving the product or influencing people’s behavior in relation to it.
Here are three examples of typical conjoint analysis applications:
-
Market research
The most common use of conjoint analysis is for discovering the relative importance to consumers of the attributes or features of a product, such as a smartphone: e.g. its operating performance, screen quality and design, camera quality, battery life, size, price, etc.
For example, how much more or less important is a high-quality camera than a long-lasting battery? How sensitive are consumers to price? Does everyone prefer large phones, or do some people like small ones?
In possession of such consumer-preference information, the phone manufacturer is in a strong position to design the “best” phone technically possible: the phone that maximizes market share.
Also, combining this information with information about consumers’ socio-demographic characteristics such as their age, gender, income, etc enables the overall market of smartphone consumers to be segmented, whereby different phones are designed for and marketed to identifiable sub-groups, i.e. market segments.
Most consumer products in existence today have benefited from market research based on conjoint analysis. For many businesses, conjoint analysis is closely associated with supporting the companies’ R&D or innovation pipeline.
-
Organizational management
Conjoint analysis is also used by organizations to support their management processes, such as discovering how an organization’s employees feel about the various employment benefits that can be offered: e.g. pay relative to holidays relative to the staff cafeteria relative to health benefits, etc.
Such employee-preferences information enables the employer to design the “best” benefits package possible (most preferred by employees) that is also fiscally viable for the organization (success story).
-
Policy-making
Finally, conjoint analysis is increasingly used to support government policy-making, such as discovering how citizens feel about the possible features of a country’s superannuation or pensions policy.
For example, how important is the age of eligibility versus the pension payout versus universality versus the size of the tax increases needed to support a more generous pension?
And do women have different preference about these features than men? Do rich people, who typically pay more tax and have their own savings, feel differently than poor people? And so on.
Conjoint analysis enables important policy questions like these to be studied, e.g. see
Au, Coleman & Sullivan (2015) . Supported by such citizen-preferences information, the “optimal” policy can be designed for the country.

How does conjoint analysis work?
The three examples above, and all conjoint analysis in general, involve these four key components. If you get these four components right, you’re more likely to get your conjoint analysis right!
-
Attributes of the product or other object of interest – e.g. for smartphones, as mentioned above, the attributes would likely include operating performance, screen quality and design, camera quality, battery life, size, price, etc.
For most applications, fewer than a dozen attributes is usually sufficient, with 5-8 typical, which may be quantitative or qualitative in nature.
Each attribute has two or more levels for measuring alternatives’ performance, which can be quantitative or qualitative – e.g. $600, $700, $800, $900 and $1000 for phone price and ok, good and very good for operating performance.
-
Utilities, also known as part-worths (or part-worth utilities), in the form of weights representing people’s preferences with respect to the relative importance of the attributes.
The utilities from a conjoint analysis into smartphones, for example, might reveal that consumers care most about operating performance and battery life, and least about camera quality and price; and, more precisely, that battery life is, say, three times as important as camera quality. Or the reverse, etc.
The second part of the article illustrates how to interpret and apply utilities via a smartphone example.
-
Alternatives, also known as concepts or profiles, comprising combinations of attributes describing particular products or other objects of interest – e.g. configurations of smartphone attributes or features.
Depending on the application, the number of alternatives (or concepts or profiles) considered in a conjoint analysis ranges from a minimum of two up to, potentially, 10s, 100s or even 1000s of alternatives.
-
Survey participants, whose preferences are to be elicited in the conjoint analysis survey.
Depending on the application, potentially up to many 1000s of people may be surveyed, e.g. consumers, employees, citizens, etc. Common methods for finding survey participants are summarized towards the end of the article.
Experience a conjoint analysis survey yourself!
A great way to understand conjoint analysis is to experience it yourself from the perspective of a participant. Try out one or both of the two surveys below built using the 1000minds conjoint analysis software – which you are very welcome to try out too!
The first survey is about smartphones (the main example used in the article, because most readers can easily relate to it).
Alternatively – or, hopefully, as well – if you would like a more light-hearted example: the second survey is designed to help you to choose a breed of cat as a pet!


Conceptual underpinnings and terminology of conjoint analysis
The main ideas behind conjoint analysis are surveyed in this section, in the process introducing and demystifying some common terminology. This terminology can be a little bit daunting for people new to the area – but don’t worry, the fundamental concepts are easy to understand!
Let’s begin with a very brief summary of conjoint analysis’ origins.
Origins of conjoint analysis
Conjoint analysis – as mentioned earlier, also known as a discrete choice experiment (DCE) or choice modeling – has its theoretical foundations in mathematical psychology and statistics, with important contributions from economics and marketing research.
Choice modeling emerged from the research of US psychologist Louis Thurstone into people’s food preferences in the 1920s and his development of random utility theory (RUT), as explained in his journal article titled “A law of comparative judgment” (
RUT was extended by US econometrician Daniel McFadden who developed and applied DCEs, as discussed in “Conditional logit analysis of qualitative choice behaviour” (
Seminal theoretical developments in conjoint measurement were made by US mathematicians Duncan Luce and John Tukey in their article “Simultaneous conjoint measurement: A new type of fundamental measurement” (
The history of conjoint analysis in the marketing field is comprehensively traced out by Green and fellow marketing professors and statisticians V. “Seenu” Srinivasan,
Choice-based conjoint analysis (CBC)
As you would have experienced if you did either of the demo surveys above, conjoint analysis involves participants answering a series of questions designed to elicit their preferences with respect to attributes associated with the alternatives of interest – in the demo surveys, smartphones or cat breeds.
Typically, the questions asked require the person to repeatedly choose their preferred alternative from two or more hypothetical alternatives presented at a time. These two or more alternatives the person is asked to choose from in each question are often referred to as a choice set.
An example of a choice set appears in Figure 1 from the demo conjoint analysis survey into smartphones above. This choice set is the simplest possible because, as you can see, it involves two hypothetical alternatives defined on just two attributes. More “challenging” choice sets with more alternatives or more attributes are considered later below.
Making such choices is fundamental to most modern approaches to conjoint analysis. And so conjoint analysis is sometimes more expansively referred to as choice-based conjoint analysis (CBC) – in contrast to earlier, more primitive non-choice-based approaches that relied on rating or scoring methods instead of choice-based ones.
You might also be interested to know that the name conjoint analysis comes from survey participants being asked to evaluate hypothetical alternatives described in terms of two or more attributes together, such that the attributes can be thought of as being connected or joined to each other – like conjoined twins!
Discrete choice experiments (DCEs)
In the social sciences (e.g. Economics), conjoint analysis is often known as a discrete choice experiment (DCE) (
Likewise, because people’s answers are strictly hypothetical, requiring them to state their preferences by saying what they would do instead of revealing their preferences by actually doing it, conjoint analysis is classified as a stated preferences method rather than a revealed preferences method.
Trade-off analysis
As already mentioned, and illustrated in Figure 1, the alternatives in a choice set are defined in terms of two or more attributes at a time.
For most conjoint analysis methods, the levels on the attributes are specified so that people are required to confront a trade-off between the attributes (e.g. see Figure 1 again), as is fundamental to most real-world decision-making, e.g. choosing a new phone. Hence, conjoint analysis is sometimes known as trade-off analysis.
In conclusion, the terms conjoint analysis, choice-based conjoint analysis (CBC), discrete choice experiments (DCE) and trade-off analysis are largely synonymous – though some purists are able to find differences between them (
Representing people’s preferences
As summarized above, conjoint analysis involves people being presented with a survey in which they are repeatedly asked to choose which of two or more hypothetical alternatives (or concepts or profiles, as above) they prefer. From people’s choices, utilities, also known as part-worths (or part-worth utilities), in the form of weights representing the relative importance of the attributes, are determined.
As well as codifying how people feel about the attributes, the utilities are often used to rank any alternatives that might be being considered in the order in which they would be chosen by consumers or citizens (“stakeholders”), depending on the application.
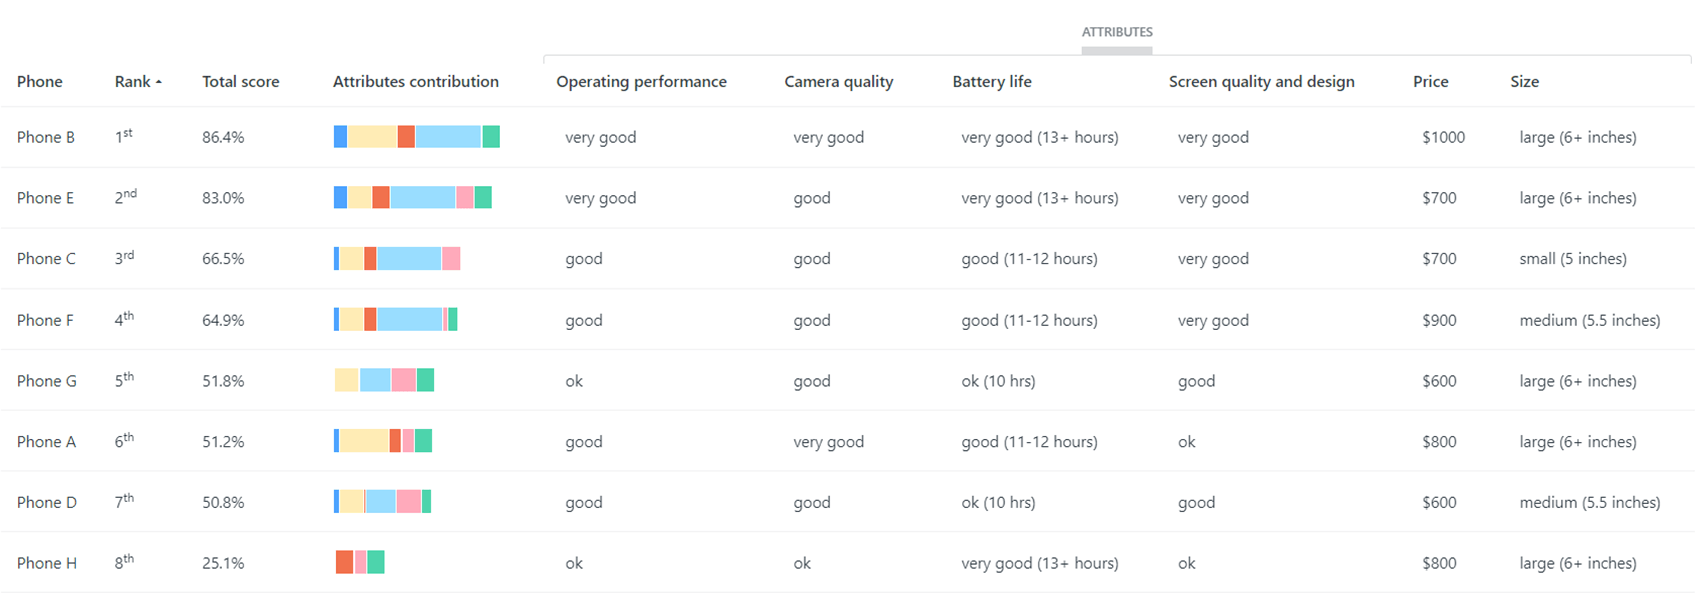
An example of a ranking of smartphone alternatives appears in Table 1. Each alternative is described as a combination of the levels on the attributes, and their utilities (weights) are added up to get total score (out of 100%), by which the alternatives (phones) are ranked.
The attributes and utilities can be thought of performing as a simple predictive algorithm: predicting the order in which people, as individuals or in groups, would choose the alternatives being considered.
As discussed earlier, these utilities and rankings of alternatives are extremely useful information for designing things that people most desire, e.g. products or government policies.
Types of conjoint analysis, and their differences
Conjoint analysis comes in a variety of “flavors” corresponding to the variety of methods available, usually supported by specialized software and/or statisticians involved in the analysis (depending on the method used).
The main differences between the types of conjoint analysis available may be fleshed out with respect to these four characteristics (attributes!):
- Number of alternatives in choice sets
- Partial-profile versus full-profile alternatives
- Adaptive versus non-adaptive conjoint analysis
- Methods for calculating utilities
These differences are now explained in turn. They are all worthwhile thinking about when you are considering how you want to do your own conjoint analysis.
Number of alternatives in choice sets
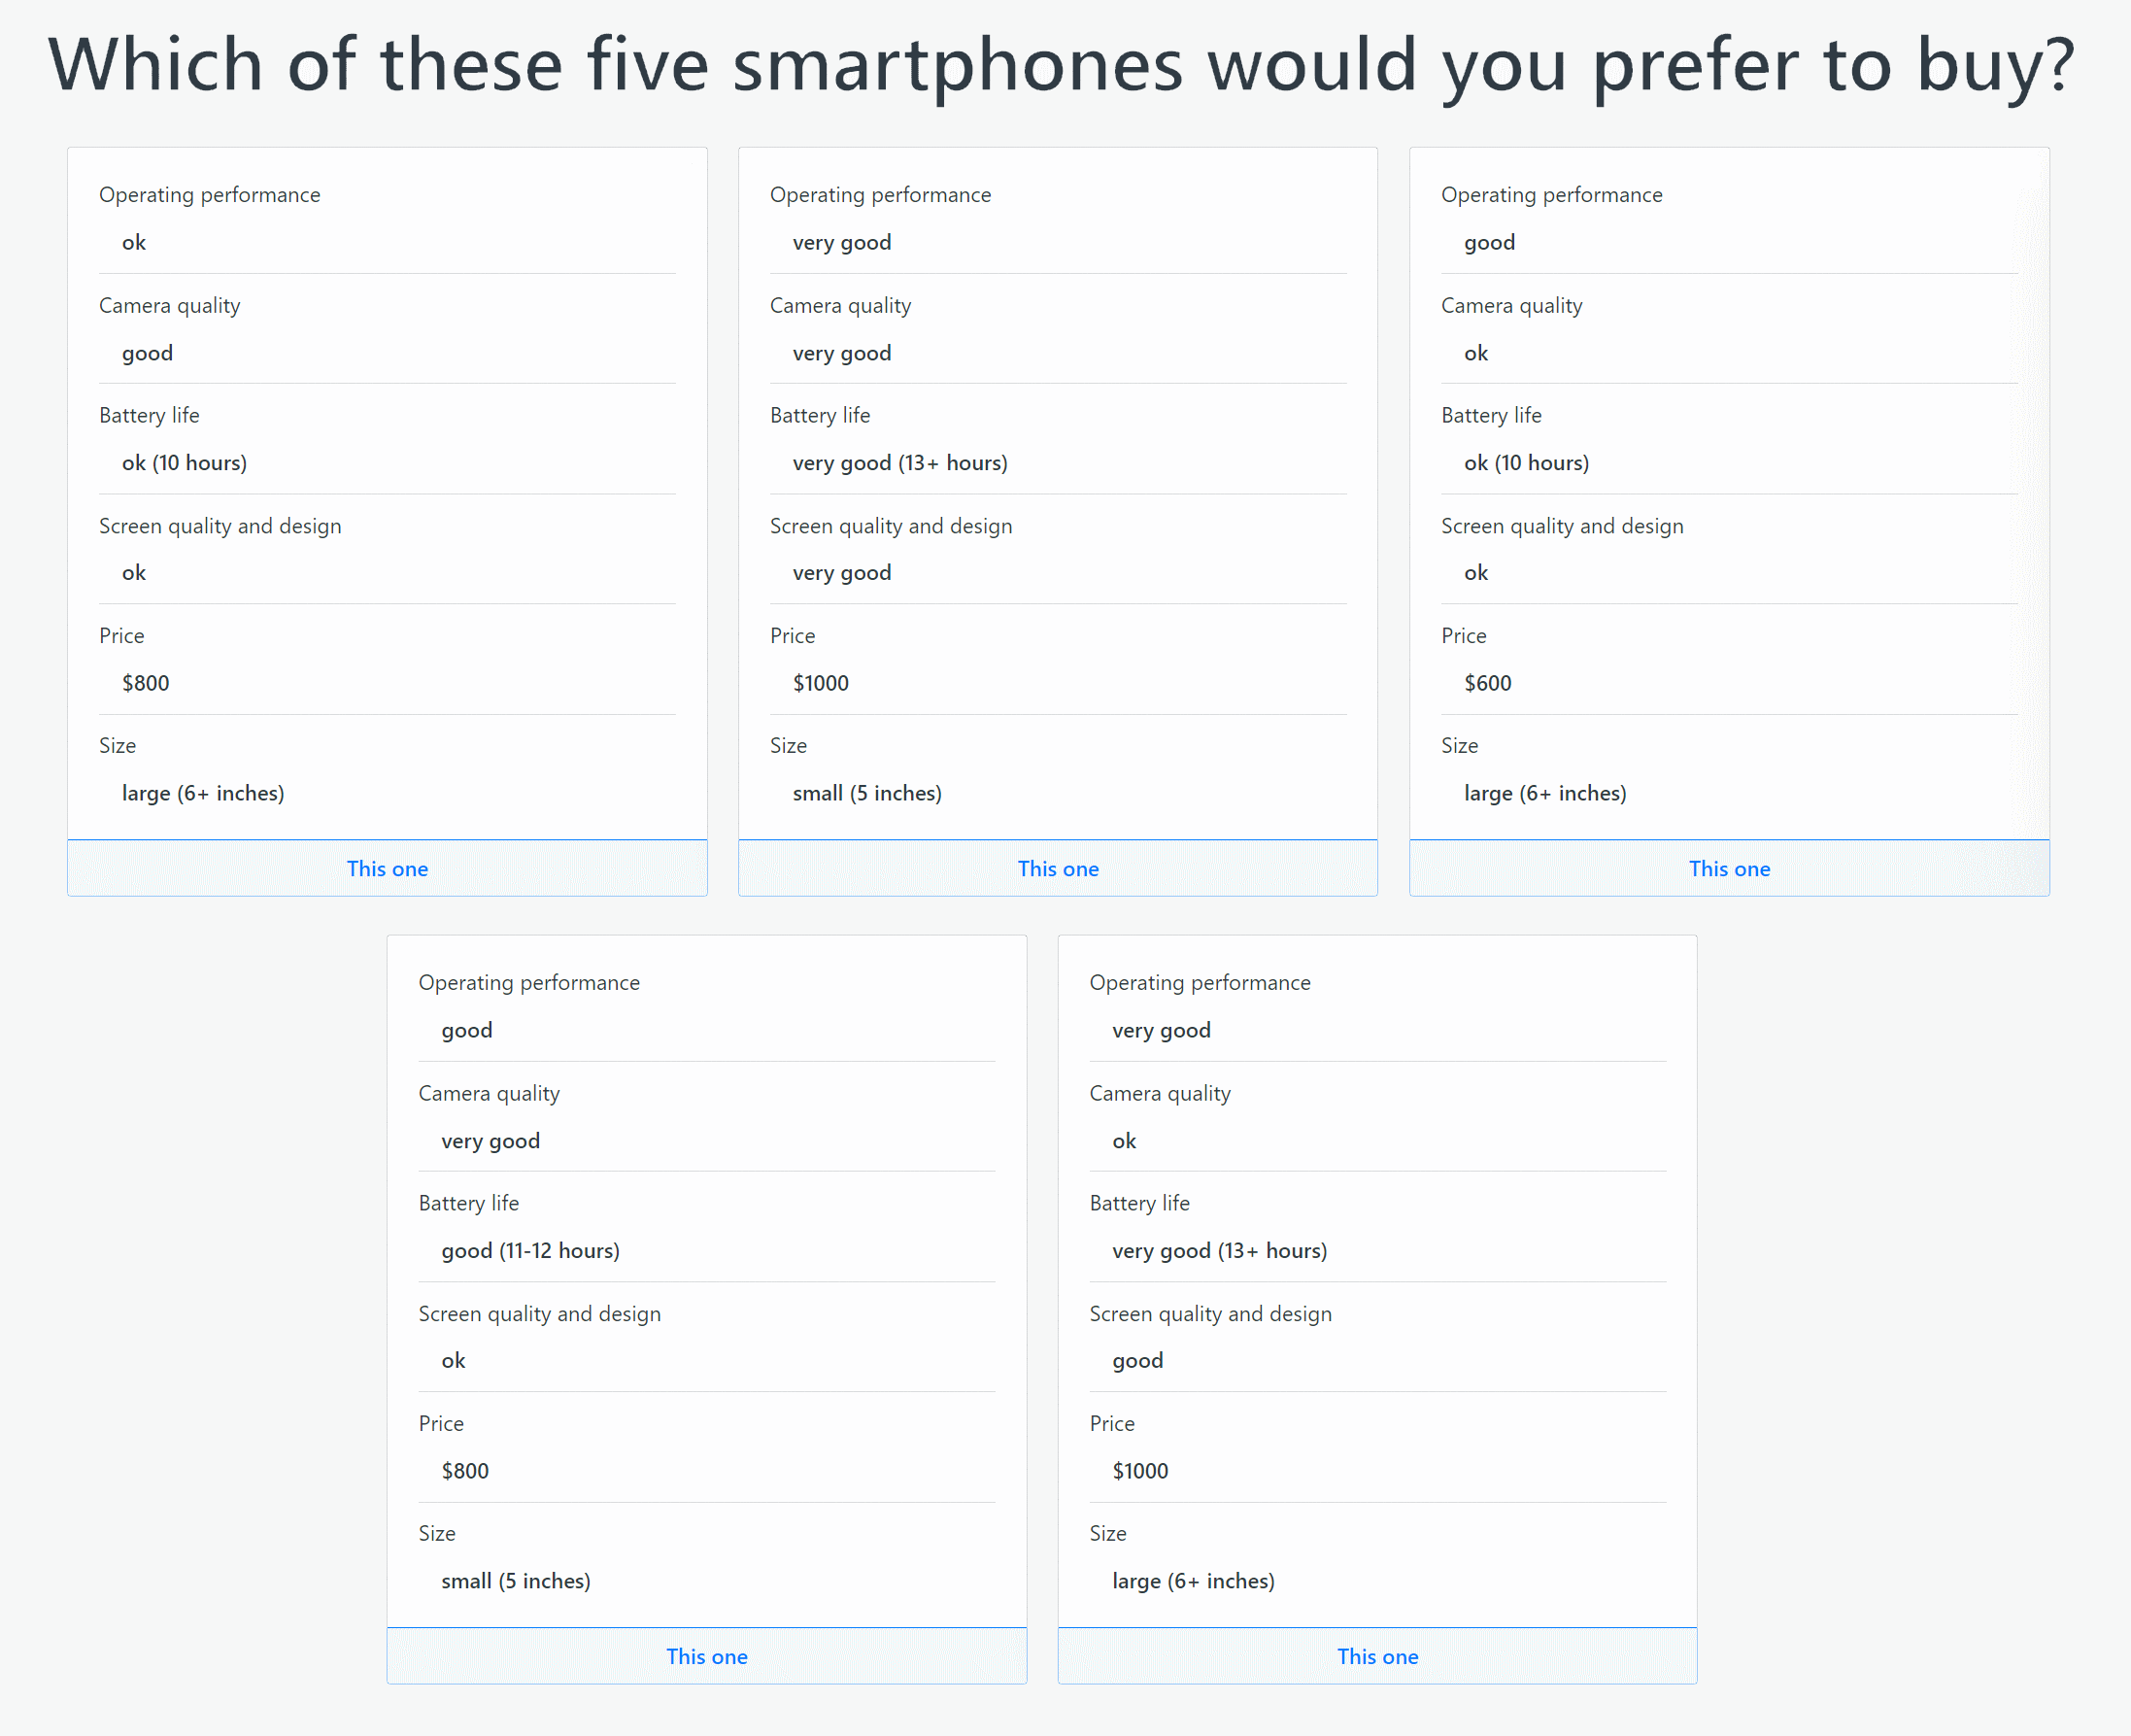
Conjoint analysis methods can be differentiated with respect to how many hypothetical alternatives there are in the choice sets that survey participants are asked to choose from, typically ranging from two to five alternatives.
An example of a choice set with two alternatives appears in Figure 2 and an example with five alternatives appears in Figure 3, where both examples include six attributes each (as discussed in the next section, choice sets also differ with respect to the number of attributes).
Choosing from choice sets with just two alternatives is known as pairwise ranking. Pairwise ranking is obviously cognitively simpler than choosing from three or more alternatives at a time. It is a natural human decision-making activity; we all make many such binary choices every day of our lives: e.g. Would you like a coffee or tea? Shall we walk or drive? Do you want this or that?
You might also like to read our comprehensive overview of pairwise comparisons and pairwise rankings. Also available is our in-depth article about Multi-Criteria Decision Analysis (MCDA), also known as Multi-Criteria Decision-Making (MCDM). These two articles, like the current one, are intended as essential resources for practitioners, academics and students alike.
On the other hand, choice sets with more than two alternatives are, arguably, more realistic in relation to the types of more complex decisions we make in everyday life – e.g. when choosing a smartphone from a group of, say, a half-dozen we are considering.
Maximum difference scaling (MaxDiff)
Some conjoint analysis methods with four or five alternatives in their choice sets ask participants to choose the “best” and the “worst” of them. This approach is known as maximum difference scaling (MaxDiff) or best-worst scaling (
As an example applied to four alternatives – A, B, C and D – the MaxDiff (or best-worst) task is for the participant to identify the best and the worst alternatives: e.g. best = C and worst = A. From these two choices, these five of the six possible pairwise rankings of the four alternatives are implicitly identified: C > A, C > B, C > D, B > A, D > A.
Likewise, if there were five alternatives, the two best-worst choices would identify seven of the 10 possible pairwise rankings of the five alternatives.
MaxDiff is efficient in the sense of reducing the number of decisions required. However, the cognitive effort involved in choosing the best and the worst alternatives respectively (out of four or five alternatives) is more than simple pairwise ranking, and an erroneous best or worst choice can have major downstream effects in terms of the implied rankings.
Partial-profile versus full-profile conjoint analysis
As well as the number of alternatives (as above), choice sets can be differentiated with respect to how many attributes they have. The examples in the previous section all had six attributes, which is known as full-profile conjoint analysis, because the alternatives are defined on all six of the attributes included in the conjoint analysis.
In contrast, partial-profile conjoint analysis is based on choice sets defined on fewer attributes than the full set – as a minimum, just two attributes at a time. Figures 4 and 5 below, analogous to Figures 3 and 1 above, are examples of full- and partial-profile choice sets respectively (with two alternatives each).
The advantage of partial-profile choice sets is that they are cognitively easier for people to evaluate and choose from than full-profile ones, and doing so takes less time. Therefore, conjoint analysis results obtained using partial profiles are likely to more accurately reflect participants’ true preferences, albeit such choice sets are arguably less realistic relative to real-world choices.
Adaptive versus non-adaptive conjoint analysis
Another key difference between conjoint analysis methods is whether the choice sets presented to participants in a conjoint analysis survey are selected – by the specialized conjoint analysis software implementing the method – in a non-adaptive or adaptive fashion.
Non-adaptive methods involve the same group of choice sets (e.g. a dozen or so) being presented to participants. Because the number of possible choice sets increases exponentially with the number of attributes and levels included – potentially in the thousands or millions – an important technical issue when a non-adaptive conjoint analysis is being set up is the selection of the small subset of choice sets to be used.
This selection exercise is known as fractional factorial design (in contrast to full factorial design). It involves carefully selecting (or designing), say, a dozen choice sets – i.e. a tiny fraction of all possible choice sets – that are intended to be representative of all possible choice sets.
Because there many thousands or millions of possible choice sets for the designers of a conjoint analysis to select from, survey participants are usually split into sub-samples and presented with their own block of specially-selected (designed) choice sets. Each sub-sample’s block of choice sets are intended to complement the other sub-samples’ blocks by effectively, and efficiently, spanning the entire (and large) space of possible choice sets.
Adaptive conjoint analysis
In contrast, adaptive conjoint analysis (ACA) methods, such as the PAPRIKA method implemented in the two demo surveys above, obviate the need for carefully selecting or designing choice sets, i.e. worrying about fractional factorial design, as discussed above.
For PAPRIKA, all possible questions based on choice sets with two alternatives defined on two attributes (e.g. Figure 1 and Figure 5 again) are potentially available to each participant. The choice sets each participant ends up pairwise ranking are determined in real time as the person progresses through them.
Fundamental to the PAPRIKA method is that it adapts as the person answers each of their questions (choice sets). Each time they answer a question, based on applying the logical property of transitivity (and the rankings of the levels on the attributes), the method chooses another question based on the earlier answer and all preceding answers. Based on their answer, another question is presented, and then another, and so on – until all possible questions have been answered by the participant.
In the process of answering a relatively small number of questions (e.g. 30), all possible choice sets defined on two attributes end up being ranked by the participant, either explicitly or implicitly (via transitivity). In addition, many potential questions based on choice sets defined on three of more attributes that could have been presented (but were not) are answered implicitly.
Methods for calculating utilities
Based on the choices that people make, mathematical or statistical techniques are used to calculate utilities for the attributes in the form of weights representing the relative importance of the attributes.
Methods for calculating utilities may be summarized as being based on regression techniques such as multinomial logit analysis, hierarchical Bayes estimation, and linear programming.
Most people do not need to understand these techniques because they are handled by the specialized software or the statisticians supporting the analysis. However, for readers interested in the technical details (with the requisite technical skills themselves!), other resources are available elsewhere, such as Kenneth Train’s book, Discrete Choice Methods with Simulation (Train 2009).
Another popular method for determining utilities is the PAPRIKA method discussed in the previous section. PAPRIKA, which automatically and in real time generates its conjoint analysis outputs, is based on linear programming techniques. Technical details are available in
PAPRIKA, implemented in 1000minds, is used in the example in the next section to illustrate the outputs from a conjoint analysis survey and their interpretation.
Also as illustrated in the next section, further analyses beyond just considering the utilities are popular, including applying them to rank alternatives and enabling the highest-ranked alternative to be identified, e.g. the “best” consumer product or government policy.
An example of adaptive conjoint analysis (ACA)
Staying with the smartphone example from earlier in the article, this conjoint analysis is to discover the relative importance to consumers of the six attributes, and their levels, listed in Table 2. Though this is a marketing-research example, the ideas illustrated below can be generalized to other applications too, e.g. government policy-making.
The survey results presented and interpreted below were produced using the 1000minds software, which implements the PAPRIKA method for determining people’s utilities.
As explained earlier, PAPRIKA is a type of adaptive choice-based conjoint analysis: each time the person chooses between a pair of alternatives defined on two attributes (e.g. Figure 5 above), based on this and all previous choices, 1000minds adapts by selecting the next question ( choice set) to ask. From the person’s choices, the software automatically and in real time generates the conjoint analysis outputs, as illustrated below.
So that you can better relate to the example and appreciate how the data is generated, you might like to do the survey for yourself.
-
Screen quality and design
- ok
- good
- very good
-
Camera quality
- ok
- good
- very good
-
Operating performance
- ok
- good
- very good
-
Battery life
- ok (10 hours)
- good (11-12 hours)
- very good (13+ hours)
-
Size
- small (5 inches)
- medium (5.5 inches)
- large (6.5+ inches)
-
Price
- $1000
- $900
- $800
- $700
- $600
Specifying the attributes for a conjoint analysis
When setting up a conjoint analysis, an important preliminary step is coming up with the attributes and their levels for the survey. Depending on the application, the attributes can be identified from reviews of the literature, competitor analyses and scans, technical reviews, “blue skies thinking”, facilitated discussions, expert opinions, focus groups and surveys.
The attributes should be carefully structured to avoid double-counting and minimize overlap between them. For example, for this smartphone application, having operating performance (see Table 2) as well as operating speed as attributes would damage the validity of the conjoint analysis results.
In most conjoint analysis surveys, the participants evaluate the same group of attributes, such as the six above. However, in the 1000minds software used for this illustration, the survey can be set up so that each participant gets to select the attributes that are most important to them from a potentially extensive (and exhaustive) list of optional attributes for their survey.
Also, it’s important that the levels on each attribute are carefully specified with respect to how many there are, their wording and their preferred ranking, i.e. from least-preferred to most-preferred down the page above. Again in the software used here, the preferred rankings of the levels can be specified as fixed (pre-determined) by the survey administrator or they can be self-explicated (ranked) by the participants themselves. Self-explicated levels are discussed and illustrated later below.
Utilities
For simplicity, there are just five participants in this illustrative conjoint analysis survey: Bao, Neha, Peter, Sajid and Susan.
Of course, most real surveys would likely include 100s or 1000s of participants. (Also, in general, the way a sample is selected – e.g. randomly – is more important than simply how large it is.)
It is good practice to apply data exclusion rules to check people’s survey responses to filter out random or insincere responses so that only “high-quality” (valid and reliable) data is used for generating the conjoint analysis outputs. Our five participants in the illustrative survey have passed these checks!
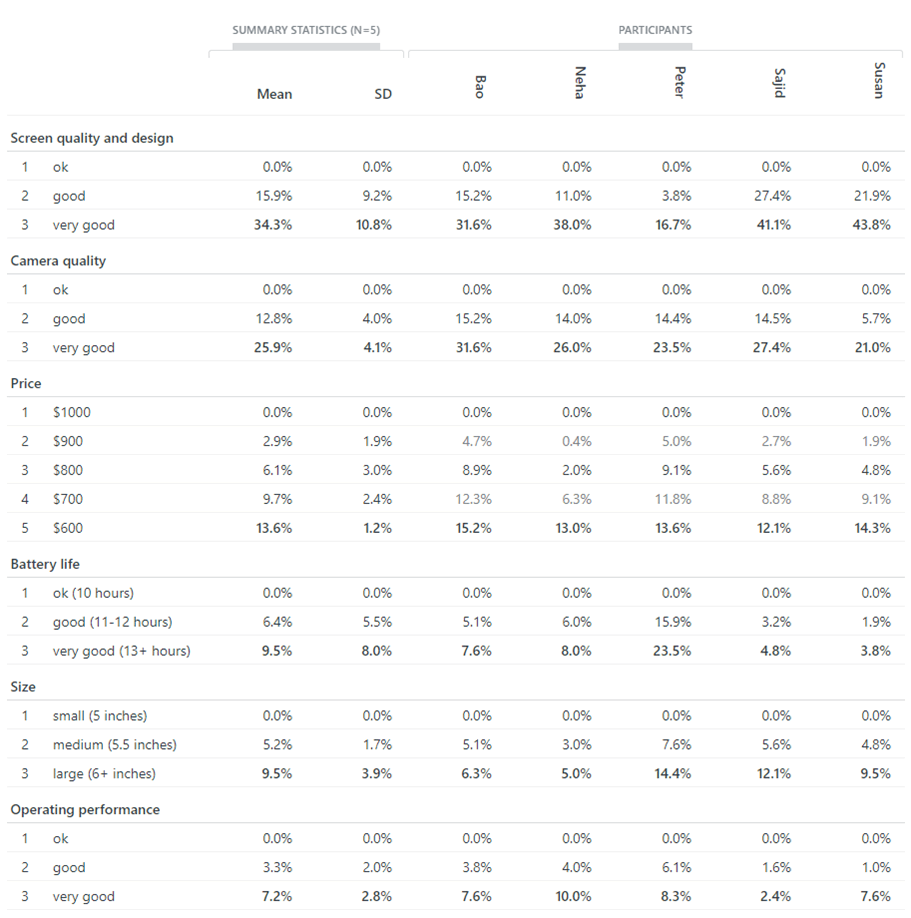
Their individual utilities are reported in Table 3, as well as the means and standard deviations (SD) of the utilities across the five participants, which are calculated in the usual way.
In short, Table 3’s utilities codify how Bao, Neha, Peter, Sajid and Susan, as individuals and on average, feel about the relative importance of the six smartphone attributes.
For each participant and the means, each utility value captures two combined effects with respect to the relevant attribute and level:
- the relative importance (weight) of the attribute
- the degree of performance of the level on the attribute
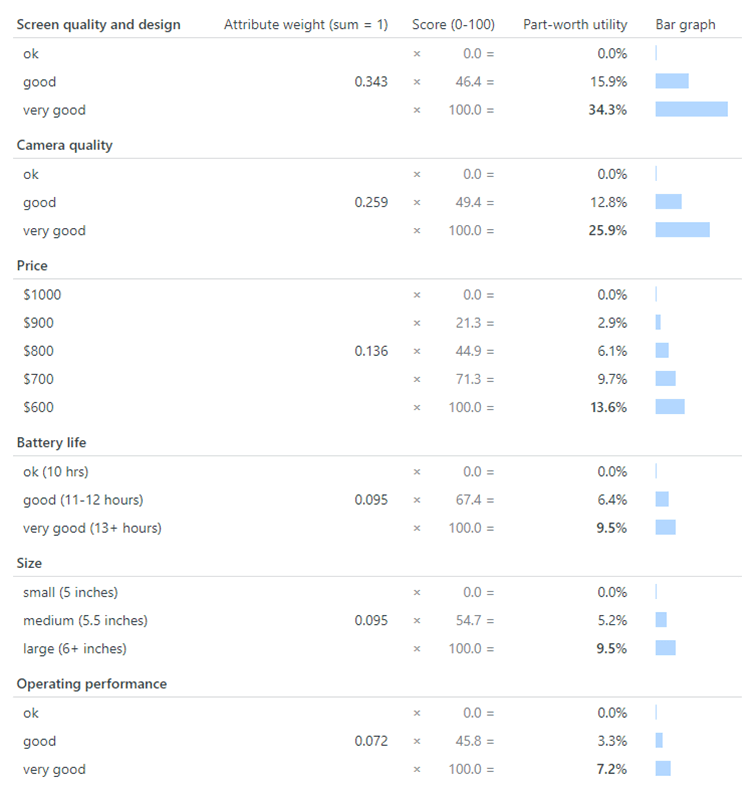
A convenient short-cut to appreciating these two effects is to look at Table 4 which reports an equivalent representation of Table 3’s mean utilities as “normalized weights and scores”. This equivalence is easily confirmed in Table 4 by multiplying the weights and scores to get the utilities (means).
The two effects are now explained in detail in the next two sub-sections. If you already understand utilities, feel free to jump to the next section.
Relative importance (weight)
In Table 3, the relative importance of an attribute, to a participant or on average, is represented by the bolded percentage value in the row for the attribute’s most-preferred level in the table.
For each participant and the mean, these bolded values sum across the attributes to a total of 100%; in other words, the weights on the attributes sum to one. These weights can be interpreted in relative terms, i.e. relative to each other.
Moreover, as will be discussed in more detail later below (don’t worry if this is unclear to you now), from the perspective of each participant and on average, the theoretically “best” alternative, corresponding to the most-preferred levels on all the attributes, has a total utility of 100%, i.e. the sum of the six weights, e.g. the means: 34.3 + 25.9 + 13.6 + 9.5 + 9.5 + 7.2 = 100
At the other extreme, the total utility of the “worst” alternative, with the least-preferred levels on all the attributes, is 0%, i.e. the sum of the six zeros (for a participant or the means).
Thus, as will be applied later below, all possible combinations of the levels on the attributes, corresponding to different configurations of the alternatives (phones), receive a total utility in the range of 0%-100%.
This point is worthwhile emphasizing now because it enables us to appreciate that out of a possible maximum total utility of 100%, as can be seen in Table 3’s “mean” column, 34.3% is going on screen quality and design, 25.9% on camera quality, and so on for the other attributes, all the way down to 7.2% for operating performance.
Thus, we can see that the most important attribute to survey participants on average is screen quality and design (34.3%) and the least important is operating performance (7.2%). It can also be said that “screen quality and design’s importance is 34.3%” and “operating performance’s importance is 7.2%”. Their ratios reveal their relative importance: screen quality and design is 4.8 times (i.e. 34.3 / 7.2) as important as operating performance.
Of course, in general, an attribute’s relative importance – the magnitude of its weight (utility) – depends on how its levels are defined. The broader and more salient the levels, the more important will be the attribute to people.
For example, any of the non-price attributes in this example would be more important to people (have higher utility) if their highest level was spectacular rather than just very good – e.g. a spectacular camera is more desirable than one that is (merely) very good, and this would result in a higher utility value.
Performance on the attribute
For each participant, the utility value for a level on an attribute represents the level’s degree of performance on the attribute.
On each attribute, the lowest level corresponds to the minimum (“worst”) possible performance, which is always worth 0%. At the other extreme, the highest level corresponds to the maximum (“best”) possible performance, i.e. the overall weight of the attribute. Levels between these two extremes correspond to some fractional value of the attribute’s maximum possible utility.
For example, as can be seen in Tables 3 and 4, for screen quality and design, ok (the worst possible level) is worth 0% and very good (best) is worth 34.3%. Between these two extremes is good, which is worth 15.9%, i.e. more than 0% and less than 34.3%.
The utilities data in Table 3 underpins all the subsequent analyses and interpretations discussed below.
However, before proceeding, it’s worthwhile considering the possibility of the preferred ranking for the levels of an attribute being ranked, or self-explicated, by the participants themselves instead of being fixed by the survey administrator. Also discussed is the possibility of participants selecting their own preferred attributes from a list of optional attributes for their survey.
Self-explicated levels and optional attributes
In general, for some (perhaps most) attributes in a conjoint analysis, their levels have an inherent and incontrovertible (or automatic) ranking, and so it is appropriate for the survey administrator to pre-determine their ranking.
For example, all else being equal, a lower priced phone is always more desirable than a higher priced phone; a very good camera is always preferable to an ok camera (again, all else being equal); and so on for the other attributes (except size).
In contrast, some levels (perhaps a minority) do not have an inherent and incontrovertible ranking, and so their rankings are flexible and need to be self-explicated (ranked) by the participants themselves.
Phone size is a good example of such an attribute. Some people prefer large phones, whereas others prefer medium or even small phones, e.g. because they fit in pockets better or are easier to use for people with small hands.
Hence, the smartphone survey was set up with a preliminary self-explication exercise that asked participants to rank the levels for size before proceeding to answer the trade-off questions. This preliminary self-explication exercise appears in Figure 6; to experience this exercise for yourself you might like to do the survey if you have not already.
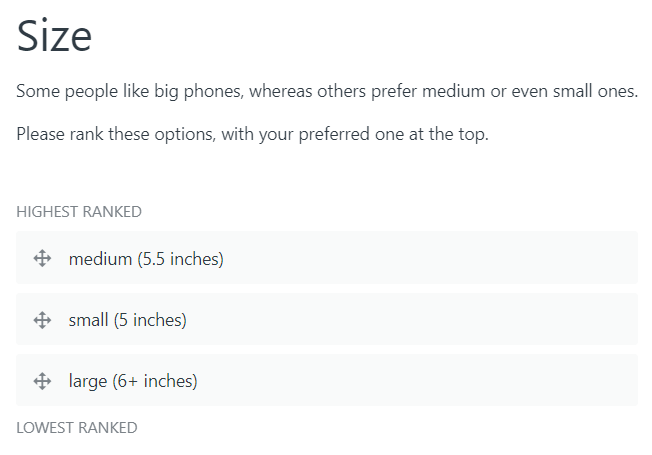
Notwithstanding the example survey’s self-explication exercise, all five participants chose to rank the levels for size in the order above: large is preferred to medium which is preferred to small. This result is confirmed in Table 3 where if you look carefully at the utilities for size you will notice that for all participants’ their highest (bolded) utility is for large, followed by medium and then small.
This unanimous ranking of the levels for size by the participants was a very happy accident – because it makes the explanations based on this example (Table 3) in the remainder of the article a bit easier (and more concise)!
Possible but ruled out here for simplicity
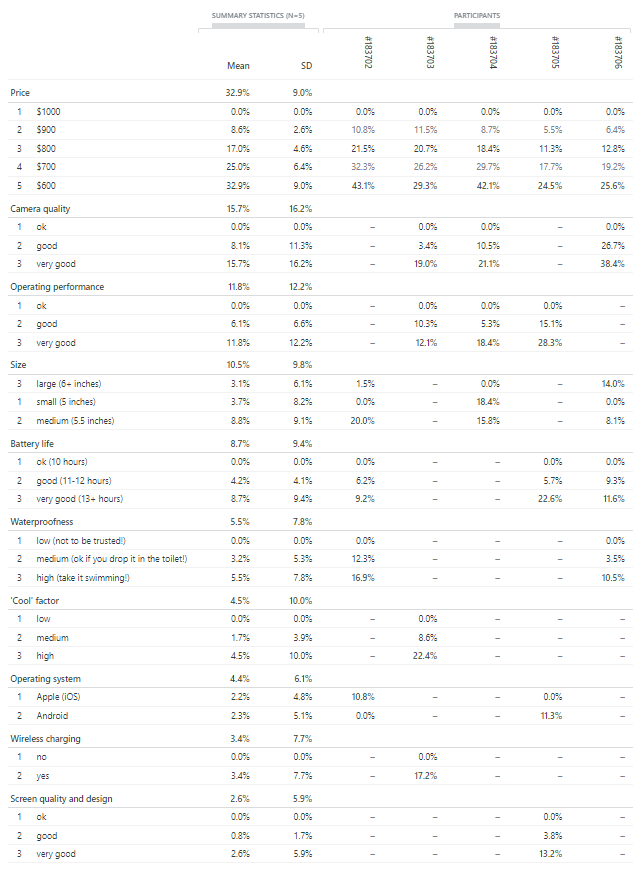
However, of course, if this were a real survey with potentially 100s or 1000s of participants, it’s almost certain that some participants would have ranked the levels differently. The results reported in Table 5 from a second illustrative survey – this time with five anonymous participants (number IDs) – gives you a taste of the effect such a difference would make to the resulting utilities.
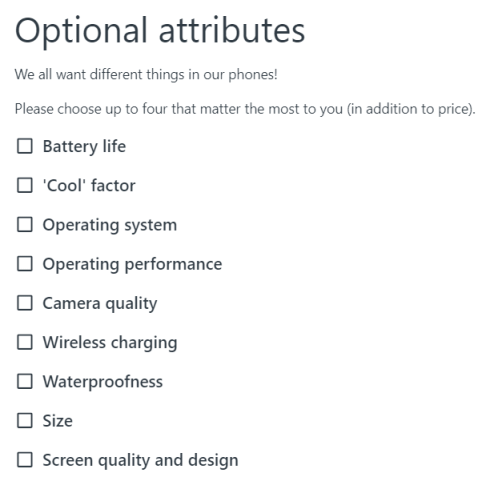
In addition, this second survey was set up to allow participants to select the attributes that are most important to them from a potentially extensive (and exhaustive) list of optional attributes for their survey, as illustrated by Figure 7. The gaps in Table 5 (“missing data”) correspond to attributes that were not selected by participants.
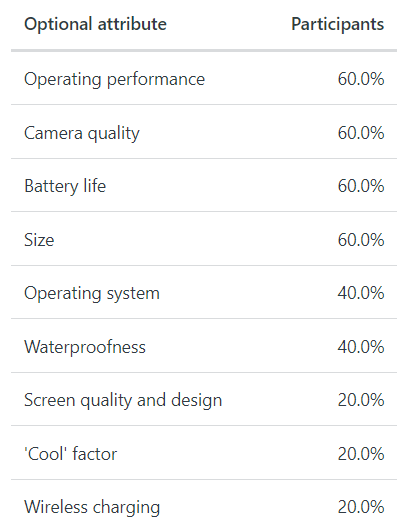
The participants’ attribute selections are summarized in Tables 6 and 7 and are easy to interpret. For example, 60% (3 out of 5) of the participants selected operating performance (and 40%, or 2 out of 5, did not), and all five people selected different groups of attributes (Table 7).
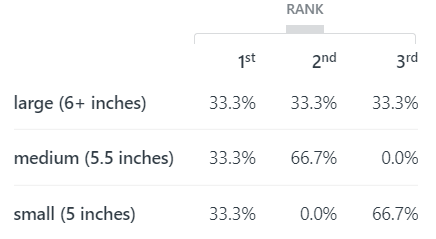
With respect to phone size, as summarized in Table 6, only three people (60%) selected this attribute. Of these three people, as summarized in Tables 8 and 9, one each (33%) chose each of the three levels, large, medium and small, as their preferred level. This result is confirmed by the relative magnitude of their utilities in Table 5.
In general, the subsequent analysis and interpretation of the utilities from a survey with self-explicated levels and/or optional attributes (Table 5) is a bit more complicated than interpreting the utilities from the simpler original survey example above (Table 3). Therefore, for the sake of clarity and relative brevity, the discussion in the remainder of the article is based on the simpler example.


Attribute rankings
Continuing with the various presentations and interpretations of the survey participants’ utilities in Table 3, the rankings of the attributes for each of the participants are reported in Table 10 (consistent with the relative magnitudes of the participants’ weights in Table 3). Also reported are the mean and standard deviations (SD) of the rankings across the participants.
Radar chart
Participants’ weights on the attributes (again, from Table 3) can be nicely visualized using a radar chart, which is sometimes also known as a web, spider or star chart, as presented in Figure 8.
A radar chart summarizes each person’s strength of preference for the six attributes, where each person’s weights have a differently colored “web”: the further from the center of the chart, the more important is the attribute. The dashed black line shows the mean utilities.
A radar chart is useful for revealing the extent to which people’s preferences are similar or dissimilar, i.e. overlap or not. Of course, radar charts become increasingly cluttered and harder to interpret as the number of participants increases.

Attribute relative importance
As explained earlier, the relative importance of an attribute to a participant, or all participants on average, is represented by the weight corresponding to its most-preferred level.
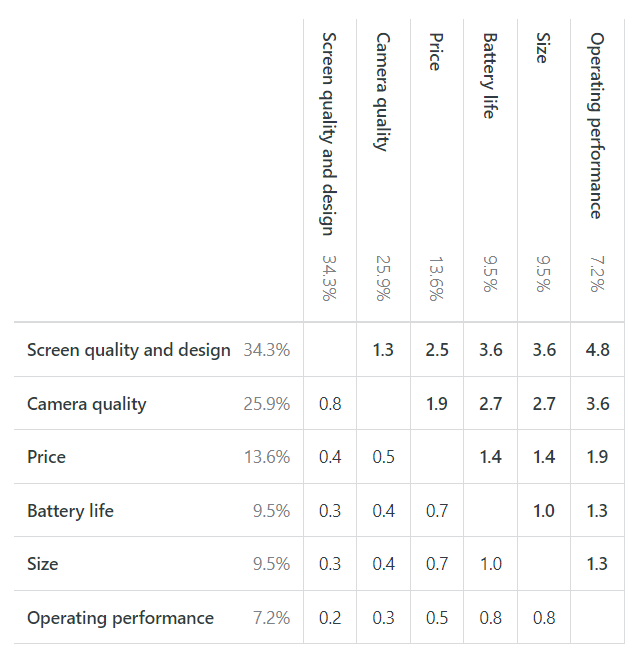
Based on the mean utilities, each number in the main body of Table 11 is a ratio corresponding to the importance of the attribute on the left relative to the importance of the attribute at the top of the table. These ratios are obtained by dividing the utility on the left by the utility on the right (and notice that corresponding pairs of ratios are inverses of each other).
For example, screen quality and design is 4.8 times (34.3 / 7.2) as important as operating performance; and operating performance is 0.2 times (7.2 / 34.3), or one-fifth, as important as screen quality and design.
In some fields, such as Economics, these ratios of relative importance are known as marginal rates of substitution (MRS).
Rankings of entered alternatives
Our focus so far has been on people’s utilities and a variety of presentational lens through which they can be viewed and interpreted. Utilities are obviously the fundamental output produced by a conjoint analysis. They are important because they capture how people feel about the attributes of interest.
In addition, given utilities represent people’s preferences, there is also great power in applying them to predict people’s behavior with respect to the alternatives of interest as described on the attributes.
A common business application, with obvious analogues in other areas (e.g. designing government services and policies), is using the utilities to predict consumers’ demand for products. These predictions can be used to help design new products or improve existing ones in pursuit of higher market share.
Thus, possible product configurations – as explained earlier, known generically as alternatives, concepts or profiles – for possible new and/or existing products and competitors’ offerings can be modeled (entered in the software used) to predict market shares or market shifts that might eventuate.
Such modeling is useful for answering questions like, “What would it take to turn our product into the market leader or to, at least, increase its market share?”
Continuing with the smartphone example, Table 12 shows how eight smartphone alternatives (or concepts or profiles) are ranked when the mean utilities from the survey are applied to each phone’s ratings on the attributes (shown in the table). The ranking is based on the alternatives’ total scores, which is calculated for each alternative by adding up the utilities for each level on each attribute.
For example, Phone B’s total score of 86.4% is calculated by adding up the mean utilities from Table 3 for very good ratings on the first four attributes in Table 12 and a $1000 price and large size: 7.2 + 25.9 + 9.5 + 34.3 + 0.0 + 9.5 = 86.4
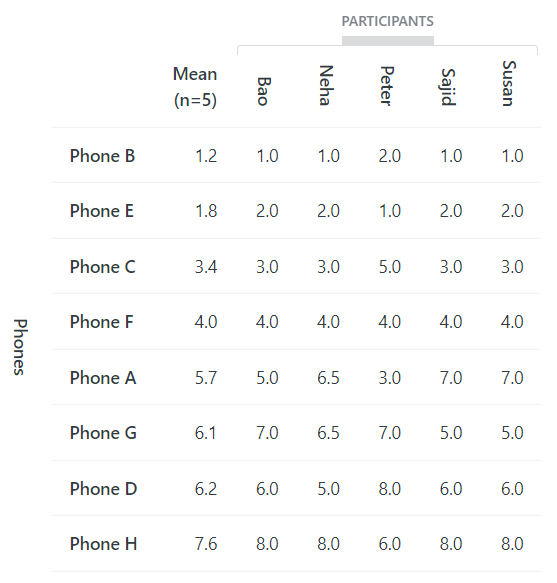
Similarly, Table 13 shows how the eight smartphones are ranked when each participant’s utilities (Table 3) are applied to the eight smartphone alternatives in Table 12. These rankings are predictions of the five people’s smartphone choices, based on their preferences in terms of utilities.
Notice that Table 13’s mean ranking is slightly different to Table 12’s ranking, which is an artifact of how the two rankings are calculated.

Market simulations (“What ifs?”)
Furnished with the market share information above, an obvious question that might arise is: “What would it take to transform a given product alternative into the market leader?”
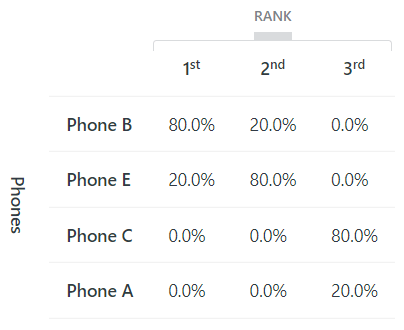
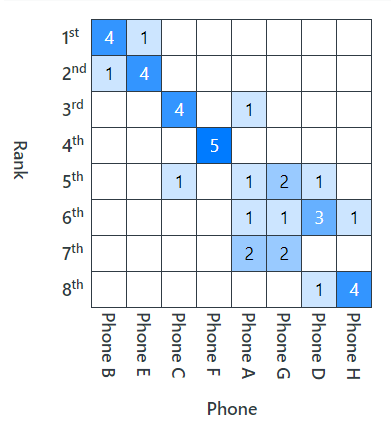
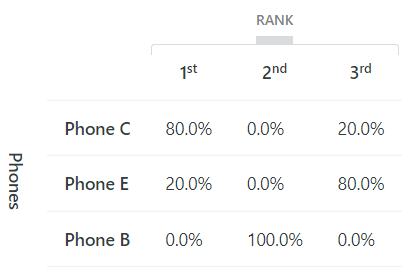
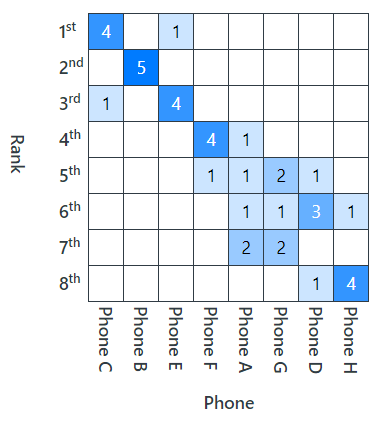
For example, as reported in Tables 14 and 15 above, Phone C, in its current configuration, has no market share, i.e. none of the five survey participants would buy it. The best it is capable of is being ranked third by 80% (4 out of 5) of the people.
Via market simulations, or posing “what if” questions, we can make predictions based on the utilities from the survey about what would happen if Phone C’s attributes were changed in a variety of ways (as mentioned before, bearing in mind that just five participants is insufficient for properly simulating a market).
Applying mean results
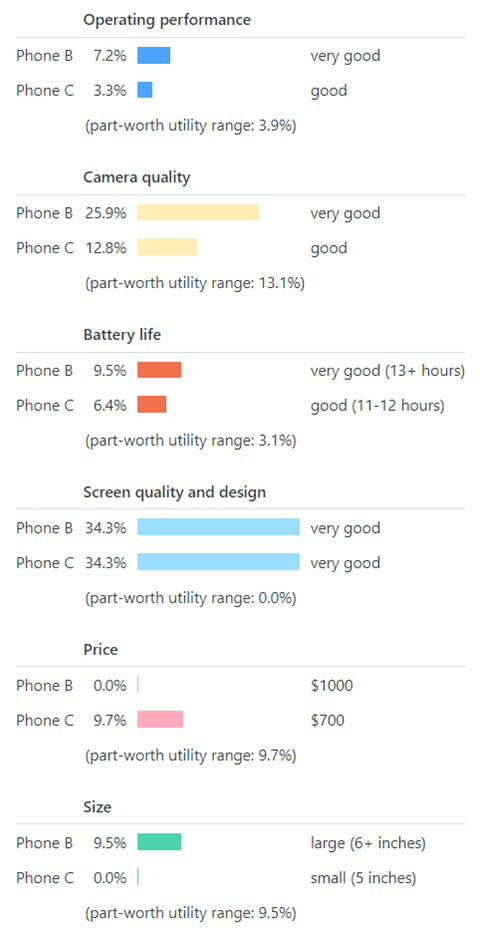
A simple starting point is to apply the mean utilities (Figure 2). Figures 9-11 compare the utilities for Product B (the current market leader) to the utilities for Product C (the “aspirant usurper”) disaggregated across the five attributes; see Figure 10 for the attribute color key.
As can be seen in Figures 9 and 10, relative to Product B, Product C is inferior with respect to operating performance (color: mid blue), camera quality (yellow), battery life (red) and size (pink). In B’s favor, it’s $300 cheaper (green) than C. They have the same very good screen quality and design (light blue).
What can be done to improve C so that, on average, it is more desirable than B?
In other words, what can be altered in terms of C’s attributes so that its total utility – currently, 66.5% – exceeds B’s 86.4%? If C can find another 20% points (i.e. 66.5 versus 86.4), its mean utility score will be higher than B’s, indicating that people would prefer C over B, on average.
Figure 11’s tornado charts, also known as butterfly charts (both names derive from their shapes), is useful for identifying possible combinations of attribute changes to increase Phone C’s total utility score by 20%. A tornado chart shows the effect on an alternative’s score of lower or higher ratings of ±1 level on each attribute, i.e. one-way sensitivity analysis.
For example, if C’s camera were upgraded from good to very good (+13.1%) and increased in size from small to medium (+5.2%) – so far, realizing 18.3% of the 20% needed, i.e. 1.7% more is needed – then either boosting operating performance from good to very good (+3.9%) or battery life from good to very good (+3.1%) would be sufficient.
Other permutations are possible too, including ones where the price is cut from $700 to $600 – though this might not be economically viable given the above-mentioned product upgrades are likely to raise the phone’s per unit cost. Such decisions about what changes are viable depend on economic and technical considerations overall.


Applying individual results
Market simulations (what ifs?) can also be performed at the level of the individual survey participants, which is more realistic than dealing in averages (as above). Changes to an alternative’s attributes can be traced through to see how each person is expected to respond and the predicted effect on market share.
Tables 15 and 17 show the predicted market shares and rank frequencies if Phone C’s camera is upgraded from good to very good, its size is increased from small to medium and its operating performance improved from good to very good.
Now 80% (4 out of 5) of the participants prefer Phone C (compared to none before the upgrades), and Phone B’s market share is 0% (from 80%) – e.g. compare Tables 16 to 14 and 17 to 15.
Phone C’s upgrades have been very successful! It now rules the market. Bravo!
In a similar fashion to the analysis above, it’s easy to derive estimates of price elasticity of demand, capturing the sensitivity of market demand to price changes, by changing an alternative’s price and tracing out the effects on its market share.
Rankings of all possible alternatives
As well as rankings of particular entered alternatives (e.g. eight, as above), it’s possible to consider the ranking of all hypothetical combinations of the attributes.
In the smartphone example, five of the attributes have three levels and price has five, and so there are 3 × 3 × 3 × 3 × 3 × 5 = 1215 hypothetically possible alternatives (phone configurations). Of course, some will be impossible, or unrealistic, in reality: e.g. a low-priced, high-spec phone.
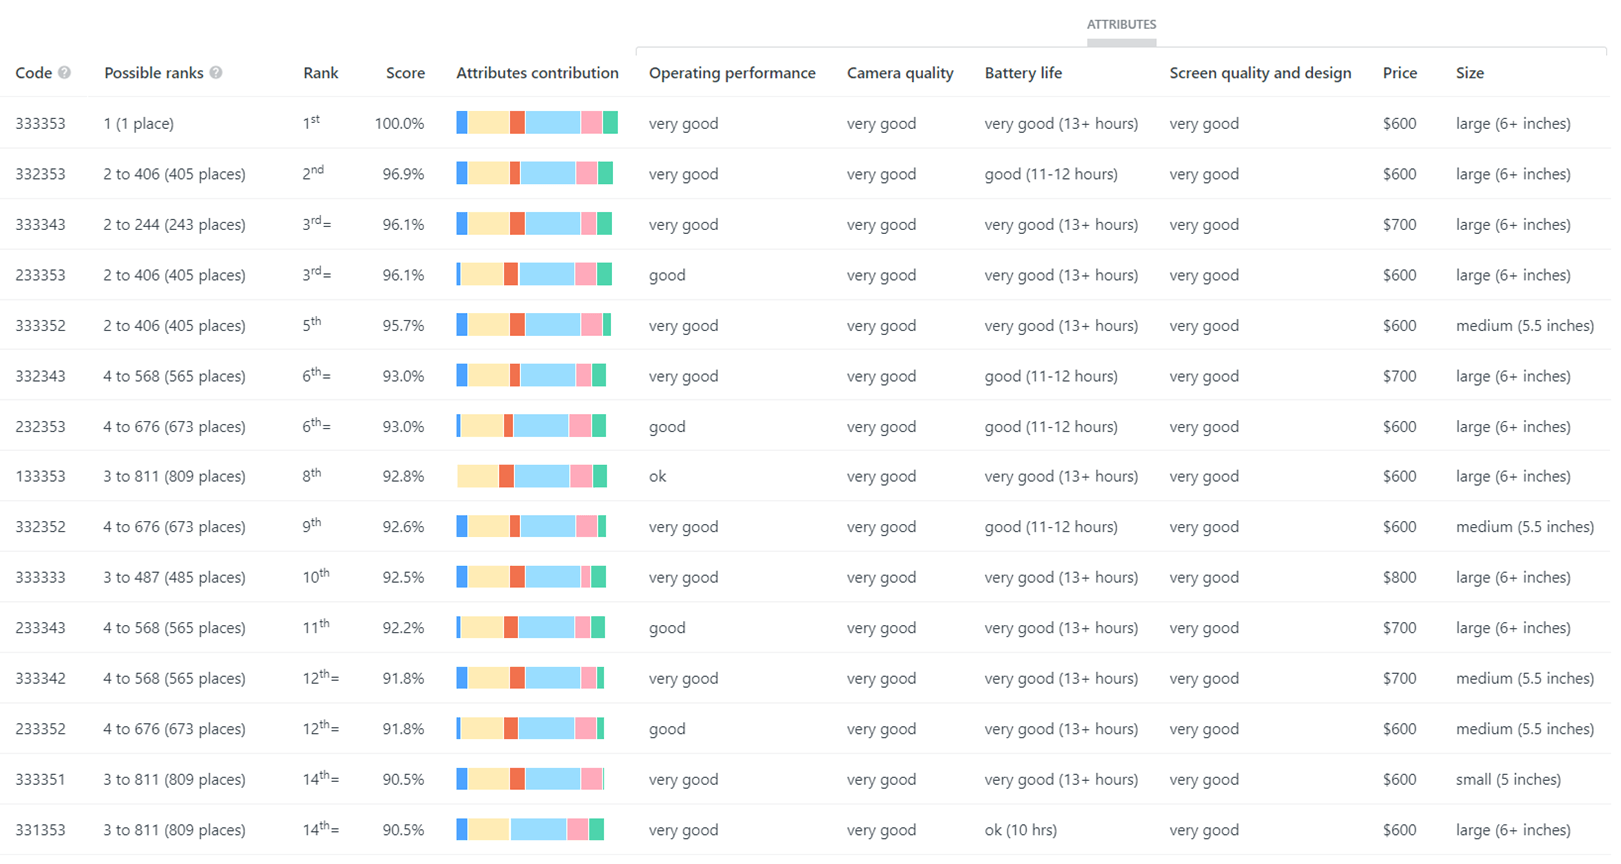
As an illustration, the top-ranked 15 phone alternatives are listed in Table 18 (where the digits in each code represent the level at which the phone is rated on the attribute.) Naturally, the top ranked phone – 1st out of 1215 possibilities – has a perfect score of 100% and is the one with the most-preferred levels on all attributes.

Marginal willingness-to-pay (MWTP)
MWTP – often shortened to just WTP – is a measure of what people would be willing to pay for an improvement in a particular product attribute, e.g. how much they would be WTP for a very good camera on their phone relative to a lower-level baseline camera.
The use of “marginal” is to remind us that the MWTP is for the change to the attribute under consideration relative to the baseline configuration of the product, i.e. the WTP for just this change in the product. It is not good practice to add up MWTPs across attributes.
The usual method for estimating WTP is to calculate the number of currency units (e.g. dollars or euros) that each utility unit – often referred to as a utile – is worth. And then it is easy to convert all the non-monetary attributes, which are valued in utiles (utilities), into monetary equivalents. These monetary equivalents can be interpreted as MWTP.
As illustrated in Table 19, based on the mean utilities reported, a price fall of $400 from $1000 to $600 corresponds to a utility gain of 13.6 – 0.0 = 13.6 utiles. Therefore, 1 utile is worth $400 / 13.6 = $29.41
Applying this price of $29.41 per utile allows the mean utilities associated with the non-monetary attributes to be converted into MWTPs.
For example, as reported in the table, consumers on average would be willing to pay $376.47 for camera quality to be upgraded from ok (baseline) to good and $761.76 to very good (again, relative to the baseline), and so on.
The proper way to interpret the first estimate above of MWTP = $376.47 is: “The average person values a camera quality upgrade from ok to good as much as they would value a price drop of $376.47”. (In other words, the increase in total utility associated with the camera upgrade is the same as if price was reduced by $376.47 instead.)
It is important to appreciate that MWTP estimates are indicative rather than definitive. Their relative magnitudes are useful for thinking about which features to prioritize for improvement if you are a phone designer.
Download the free workbook if you want to run your own WTP calculations for this example or adapt it for your own application.
| Attributes / levels | Utility (mean) | WTP | |
|---|---|---|---|
| Screen quality and design | |||
| ok | 0.0% | ||
| good | 15.9% | $467.65 | |
| very good | 34.3% | $1,008.82 | |
| Camera quality | |||
| ok | 0.0% | ||
| good | 12.8% | $376.47 | |
| very good | 25.9% | $761.76 | |
| Size | |||
| small (5 inches) | 0.0% | ||
| medium (5.5 inches) | 5.2% | $152.94 | |
| large (6+ inches) | 9.5% | $279.41 | |
| Price | |||
| $1000 | 0.0% | $29.41 | per utile, i.e. per 1% point |
| $900 | 2.9% | ||
| $800 | 6.1% | ||
| $700 | 9.7% | ||
| $600 | 13.6% | ||
| Battery life | |||
| ok (10 hours) | 0.0% | ||
| good (11-12 hours) | 6.4% | $188.24 | |
| very good (13+ hours) | 9.5% | $279.41 | |
| Operating performance | |||
| ok | 0.0% | ||
| good | 3.3% | $97.06 | |
| very good | 7.2% | $211.76 |
Cluster analysis (market segmentation)
A major strength of 1000minds is that utilities are elicited and generated for each individual survey participant, in contrast to most other methods that only produce aggregate data from the group of participants.
Individual-level data enables cluster analysis to be performed – using Excel or a statistics package such as SPSS, Stata, MATLAB – to identify clusters, or market segments, of participants with similar preferences, as captured by their utilities.
There are several methods for performing cluster analysis. The k-means clustering method is a popular one, which can be briefly explained as follows, based on the schematic in Figure 12.
- For simplicity, there are just two attributes (e.g. camera quality and battery life), as represented by the x and y axes in the panels in Figure 12, where each point in the spaces corresponds to a survey participant’s utilities for the x and y attributes.
- The k-means clustering algorithm starts by asking the analyst to set the number of potential clusters that are to be applied – referred to as k-means, where k signifies the number of clusters. In the schematic, there are three clusters, i.e. k = 3.
- For each of the three yet-to-be-discovered clusters, a starting point of a particular participant’s utilities – (x,y) co-ordinates – is randomly chosen; see the three colored points in Panel A in Figure 12.
- Next, all the individuals in each of the spaces are clustered to whichever of the three individuals’ utilities they are closest to, as measured by the clustering algorithm; see Panel B.
- Then a new representative center – i.e. mean value – for each of the nascent clusters is calculated for each of the clusters; see Panel C.
- And the process repeats: All the individuals are clustered to whichever of the three individuals (x,y co-ordinates) they are closest to. This process keeps repeating until no further changes are possible; see Panel D.
- Finally, having identified clusters of utilities (e.g. three clusters, k = 3, as above), the usual next step is to test the extent to which each cluster’s participants are associated with their observable socio-demographic characteristics (e.g. age, gender, etc) or other consumer behaviors to define targetable market segments.

The article closes with a summary of common methods for finding participants for a conjoint analysis survey.
Finding participants for your conjoint analysis survey
Depending on your application, here are some ways you can get your conjoint analysis survey in front of the right people.
If you already know your participants
If you are surveying a group you already know, such as your customers or colleagues, you can create a link (URL) for the survey within the conjoint analysis software and send the link from your own email system.
Another approach, if it is possible (e.g. 1000minds), is to load people’s email addresses into the conjoint analysis software to send out from there.
For most applications, the first approach above (sending participants a link via your own email package) is better because you are more likely to get engagement from an email sent by someone people trust – you!
The first approach also gives you more options for distributing your survey, as well as avoiding potential problems such as overly-sensitive spam filters that may be activated when emailing people from systems not directly associated with you.
If you know where people hang out
If you know what your audience looks at – e.g. a Facebook page, Reddit, your customer portal, a train station or a milk carton – you can share a link to your survey there and ask people to click it or enter it into their device.
Snowball sampling
If your survey is interesting enough, you might be able to share your survey with a small group of people, and at the end of the survey ask them to share it on social media or by email, etc with other people. The objective is to create a snowball effect whereby your survey rolls along gathering momentum.
Convenience sampling
If you do not care who does your survey – e.g. because all you want is feedback for testing purposes – you can ask anyone who is easy (convenient) to contact to do it. For example, you could send your survey to members of your personal and professional networks (i.e. your friends, family and colleagues) or to strangers on the street or in the supermarket, etc.
Advertising
You can use Facebook advertising, Google AdWords, etc to create targeted advertisements for your survey. This can be useful if your survey is interesting enough, or if your advertisement offers a reward, e.g. to be entered into a draw for a grocery voucher or a case of wine.
Survey panels
You can purchase a sample of participants from a survey panel provider or market research company. This approach is particularly useful if you need a sample that is demographically representative, for example. Such panels often have information about their panelists that let you target your survey according to their socio-demographics or interests, etc.
Here are three examples of global panel providers:
- Cint, with “millions of engaged respondents across more than 130 countries” and an online dashboard so that you can price, automate and report on the survey process.
- Dynata, with “a global reach of nearly 70 million consumers and business professionals”.
- PureSpectrum, providing researchers with the ability to source market research supply from respondents globally.
Why use 1000minds for conjoint analysis?
Quick survey setup
1000minds adaptive conjoint analysis surveys are quick and easy to set up. Enter your attributes and their levels, customize your survey’s “look and feel”, which can be in any language and include images, and then distribute your survey to up to 5000 participants per survey.
Easy to understand reporting
As responses roll in, no extra analysis is needed to derive your conjoint analysis outputs. 1000minds does it all for you automatically with reporting that is easy to understand and explain to internal and external stakeholders.
User-friendly interface
1000minds conjoint analysis is user-friendly for both administrators and survey participants due to the simplicity of the PAPRIKA method at the heart of the software. This user-friendly experience ensures higher response rates and higher quality data than alternative methods, so that you can have confidence in the validity and reliability of your 1000minds survey results.
Valid and reliable results
1000minds’ validity and reliability are confirmed by our extensive engagement with the academic world. In addition to our valued clients, 1000minds is honored to be used for research and teaching at 830+ universities and other research organizations worldwide.
Award-winning innovation
1000minds has been recognized in eight innovation awards. When we won a Consensus Software Award (sponsored by IBM and Microsoft), the judges commented:
In removing complexity and uncertainty from decision-making processes, 1000minds has blended an innovative algorithm with a simple user interface to produce a tool of great power and sheer elegance.
Try out 1000minds for free
Create a free account to discover how 1000minds conjoint analysis works for yourself. You will get access to a wide range of examples you can customize for your own projects.
If you’d like to speak with an expert about how 1000minds can be used to meet your needs, simply book a free demo today with one of our friendly team.
